I started learning a bit of R recently at a data processing workshop. I'm enjoying it so far. Sometimes it's nice to see what else is "out there" (as in, not python).
One interesting thing is the fact that many arithmetic operations on vectors are treated element-wise. So for example, adding two vectors with "+" just adds the corresponding elements. This can be useful for generating some quick function plots in very few lines and with no need for explicit loops or anything like that.
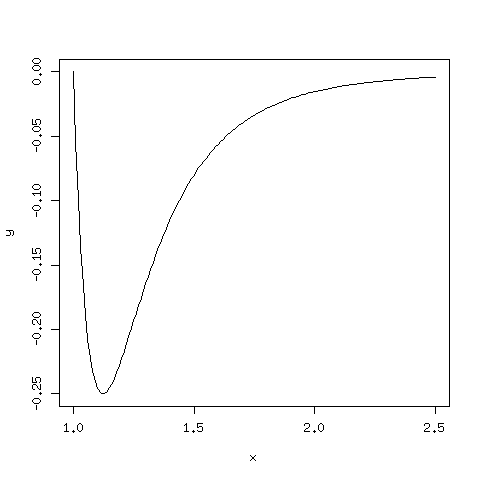
Here's a simple plot of the Lennard-Jones potential as you would create it in an interactive R session:
1 2 3 | x <- seq(0,2.5,0.01) # generate grid from 0 to 2.5 in steps of 0.01 y <- x^(-12) - x^(-6) # evaluate Lennard-Jones potential on all grid points plot(x,y,type="l") # plot with a line |
Of course, you can get fancier and create beautiful plots with R, but it's also nice for quick-and-dirty visualizations.