Python quickie! Overcast Network is a large minecraft network and they have a lot of servers. They don’t keep track of the player count on all of these servers over time, so to assess the popularity of the different servers I wrote some scripts to collect server data and plot the results.
The collection script runs every 15 minutes via cron, grabs data from the play page and dumps it in a mongoDB database. The plotting class gets the data from the database and does a bunch of data maneuvering so it’s easy to work with (I should probably learn how to use data frames at some point) and then plots it with matplotlib:
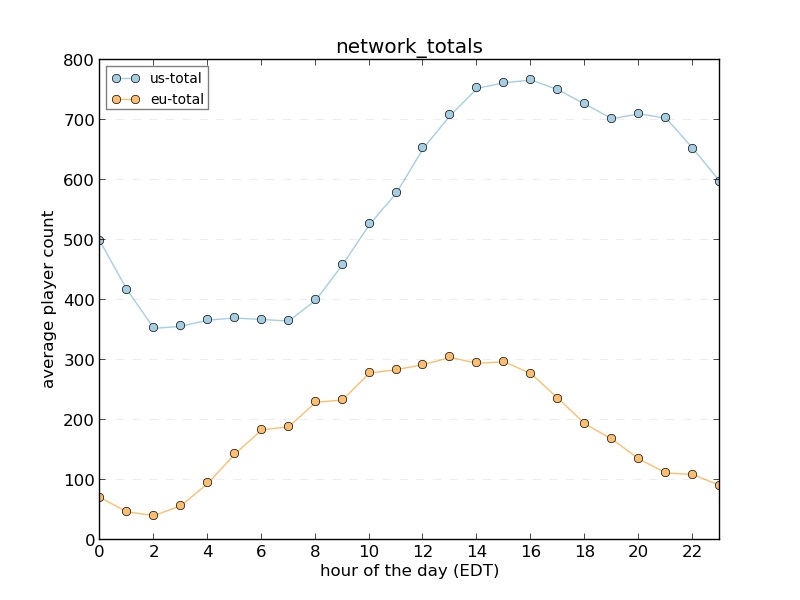
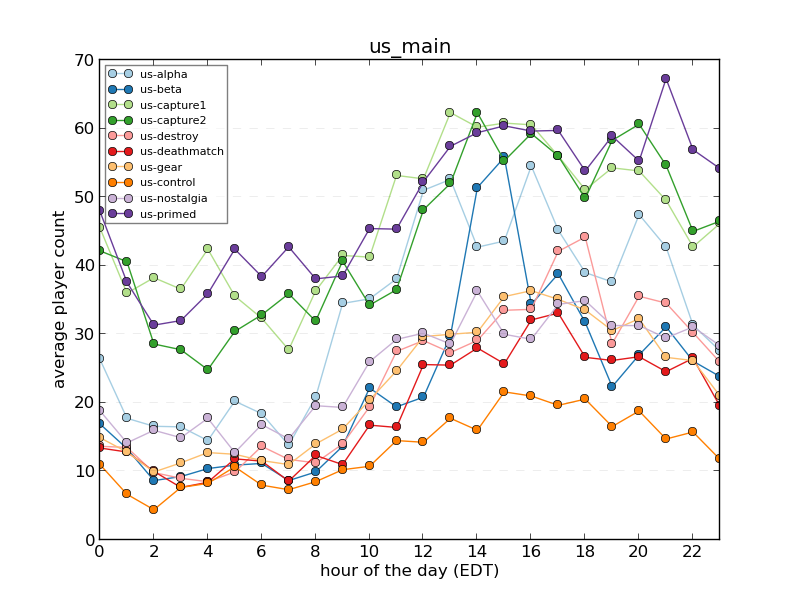
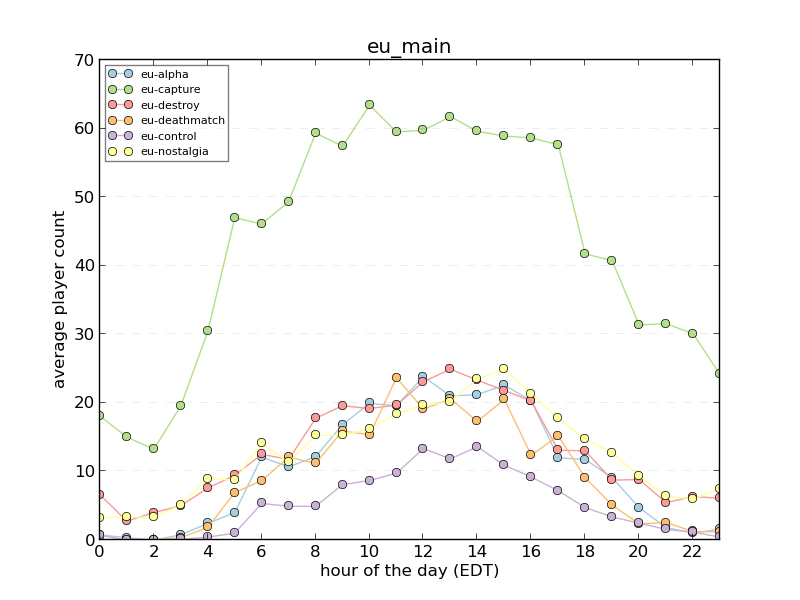
These plots show the average player activity per day (in one hour bins). There are only a few days worth of data shown here, which explains why the points tend to jump around a lot. As more data is collected, things should smooth out a bit. You can see more plots here.
Related server tracking:


