Science or Fiction Prediction: Getting a Statistical Edge

People sometimes say that if you're not sure what the answer is on a multiple choice question, you should guess c.  I've always wondered if such a system could be applied to the Science or Fiction section on The Skeptic's guide to the Universe (SGU) podcast.

What a multiple choice test may look like

What a multiple choice test may look like

Quick background for non-listeners:  The Skeptics Guide to the Universe is a super great science podcast that you should listen to.  Each episode, they play a game called Science or Fiction, where one host (usually Steve) reads science news items or facts, one of which is completely made up.  The others then try their best to determine which one is the fiction.

While it isn't practical to examine all of the multiple choice tests that have ever existed to determine if c is more likely to be correct, we can actually take a look at each round of Science or Fiction.  It turns out that they keep good show notes on the SGU's website, including each science or fiction item and whether or not it's true.

As of this post, there are 480 episodes, so it's not practical to get the data by hand, but since each episode's page is neatly organized on the website it only took a couple minutes to whip up a little scraping script with python and Beautiful Soup to get the data. (Interestingly enough, scraping through all of the pages I found a tiny mistake: Item #1 of episode 247 is missing a "1".  This broke my scraper the first time through.)

I only collected information about episodes where there were three science or fiction items (which is most of them), so that we can make a meaningful comparison:

Item 1 Item 2 Item 3
Frequency 128 119 133
Probability of Fiction 33.7% 31.3% 35.0%

So it appears that item 2 is fiction less often than items 1 and 3.  The question is, is it a "real" difference, or is it just part of the expected statistical background noise?  Basically, we're trying to empirically determine if Steve uses some sort of random number generator to determine which item will be the fiction each week. Doing a chi squared test tells us that there's a 67% chance of observing such a difference.

In other words: the frequencies are consistent with a uniform distribution, and you can't get a significant edge based on the item ordering.  Steve outsmarts us again!

I did the data collection and analysis with ipython, and you can check out the code here.

Tracking Overcast Network's Player Count with Python

eu_main


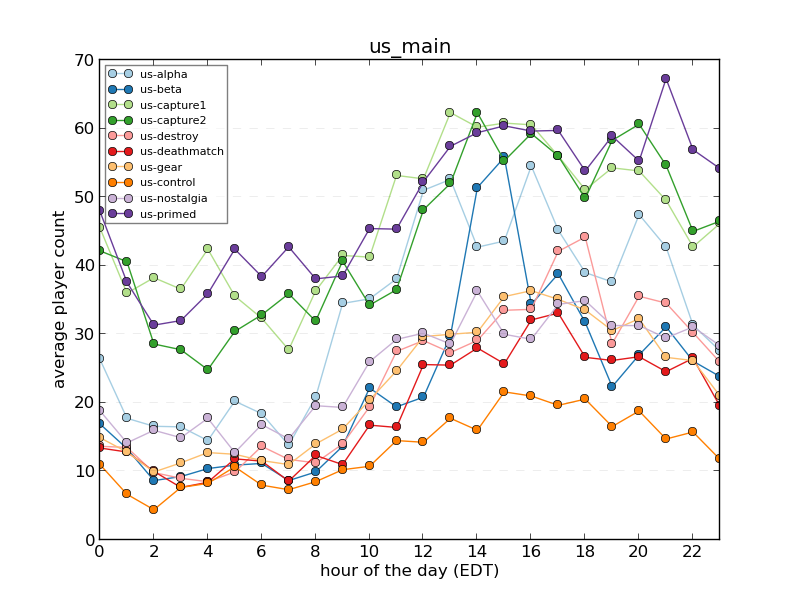
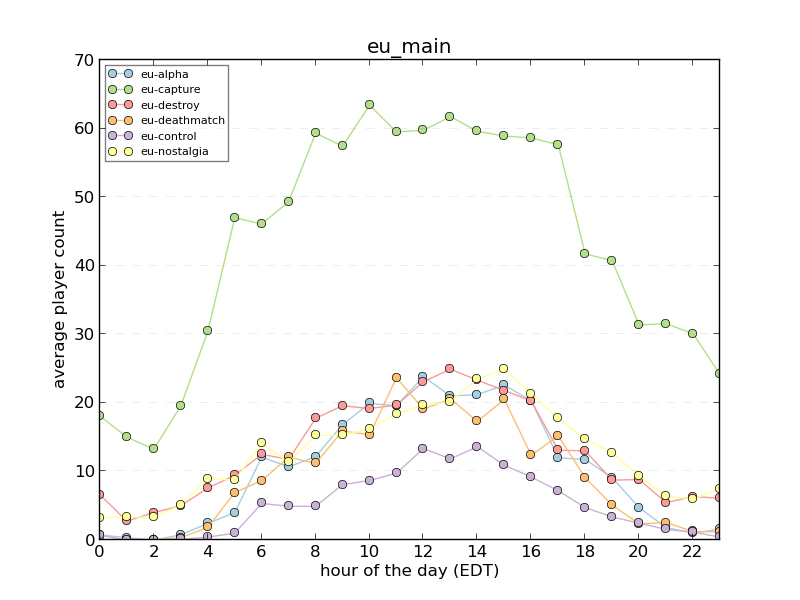
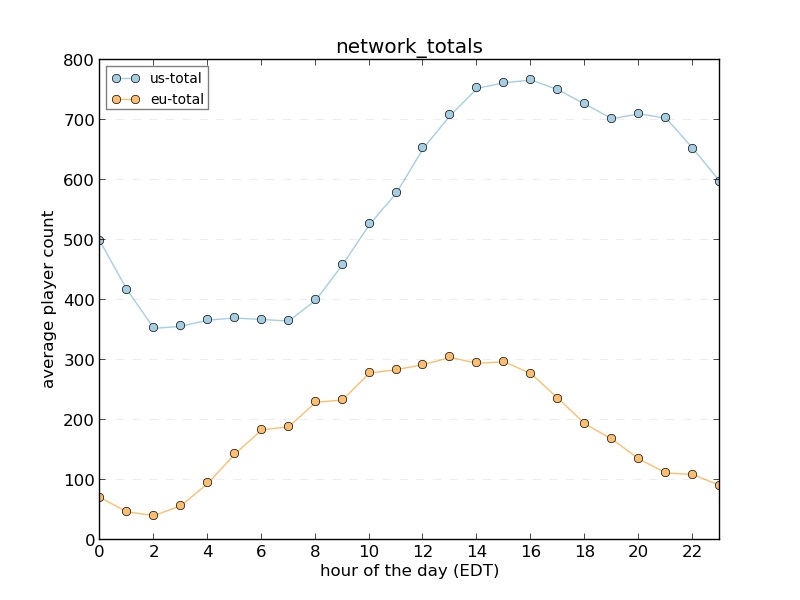
Python quickie!  Overcast Network is a large minecraft network and they have a lot of servers.  They don’t keep track of the player count on all of these servers over time, so to assess the popularity of the different servers I wrote some scripts to collect server data and plot the results.

The collection script runs every 15 minutes via cron, grabs data from the play page and dumps it in a mongoDB database.  The plotting class gets the data from the database and does a bunch of data maneuvering so it’s easy to work with (I should probably learn how to use data frames at some point) and then plots it with matplotlib:


eu_main

eu_main

These plots show the average player activity per day (in one hour bins).  There are only a few days worth of data shown here, which explains why the points tend to jump around a lot.  As more data is collected, things should smooth out a bit.  You can see more plots here.

Source

Related server tracking:

http://mc.ttaylorr.com/

Overcast Network and the Blue Team Advantage

Overcast Network (OCN) is a minecraft server network that features player vs. player (PvP) minigames.  There are a variety of gamemodes that take place on over 100 maps, where matches can last anywhere from a few seconds to a few hours.

The matches typically involve two teams of various colors, but the most common match up is red vs. blue.  This is signified through things like dyed armor and colored name tags.  Some people have speculated that, in certain situations, one team may have an advantage over the other.  Blue, for example, blends in better with water.  Red blends in better with things like lava and other reddish blocks, but seems to be, overall, an easier color to spot.  Some players even go out of their way to join one team color over the other, perhaps trying to take advantage of this.

Viridun

Viridun

Another potential advantage-yielding asymmetry is literal asymmetry in map design.  Most of the maps being played are symmetric for all teams - one team's side is either a mirror image or a 180 degree rotation of the other.  The map Viridun is the best example of an exception to this.  On Viridun, both teams have the same starting gear, but the map is asymmetric both spatially and in the distribution of potions hidden in various places.

The effect of these asymmetries can be tested by looking at a large number of matches and seeing who wins more often.  Perfect symmetry would be when each team wins a match 50% of the time (I'm only looking at maps with two teams here).  Of course, we can only look at a finite number of matches and so we'd expect some variation from 50%, but we can determine if this variation is within the expected range by using some basic statistics.

Results

Overall, blue won 49.685% of the matches (that sort of graph looks kind of familiar!).  This is consistent with no systematic advantage (or at least, no systematic advantage that is being exploited by players).  Breaking it down by gamemode, there is some variation, but none of the differences are statistically significant.

Looking at Viridun, however, we find that blue wins 66% of matches, which is statistically significant.  This is probably due to some combination of actual imbalances in the map and the fact that players who are very familiar with the map are aware of these imbalances and so are more likely to join the blue team, resulting in a better team.

Supporting Materials

 Data

Game Matches Blue Wins Χ2 V p
Overall 1270 49.6% 0.0504 0.0014 0.8224
Mini 450 48.4% 0.4356 0.0205 0.5093
CTW 107 57.9% 2.7009 0.2611 0.1003
DTC / DTM 85 49.4% 0.0118 0.0013 0.9136
TDM 38 55.3% 0.4211 0.0683 0.5164
Blitz 384 47.4% 1.0417 0.0532 0.3074
Viridun 142 66.2% 14.9015 1.2500 0.0001

Gamemode Glossary

  • CTW (Capture the Wool) - One team tries to capture wool blocks from the other team's side (capture the flag, basically).
  • DTC (Destroy the Core) - One team tries to leak lava from a team's core by breaking it.  A variation of this is DTM (destroy the monument), which involves breaking the blocks of another team's monument with no lava involved.
  • TDM (Team Death Match) - Teams try to accumulate the most kills and least deaths.
  • Blitz - Usually TDM, and you have limited lives.  A variation of this, Rage, includes weapons that kill in only one hit.
  • Mini - "Mini" versions of DTM, DTC, and CTW that have smaller team sizes and maps.

Monty Python: Kids in the Hall

Sorry, this is not a post about British or Canadian sketch comedy shows.  It's about a brute force simulation of the classic Monty Hall problem using python.  There are already a bunch of these online, but I was so disappointed in the lack of title puns that I decided to make my own.  Many of the existing simulations are quite good and fancy, so I like to classify mine as being more "back of the envelope" python.

Of all the problems that demonstrate the breakdown of statistical intution, the Monty Hall problem is certainly one of the most famous examples. There is already tons of information about it available online, so I won't go into much detail here.  For completeness, I'll shamelessly copy a simple variation of the problem statement from the wikipedia page (which I recommend you take a look at):

Suppose you're on a game show, and you're given the choice of three doors: Behind one door is a car; behind the others, goats. You pick a door, say No. 1, and the host (Monty Hall), who knows what's behind the doors, opens another door, say No. 3, which has a goat. He then says to you, "Do you want to pick door No. 2?" Is it to your advantage to switch your choice?

If this is your first time hearing the problem, think about it before you move on to the solution!  The answer follows this large picture of a goat which serves as a spoiler blocker:


Solution:

You should switch!  Switching gives you a 2/3 chance of getting the car.  This may (i.e. was most definitely probably) not your first intuitive conclusion, but it's the correct one.  Again, the wikipedia page provides many different ways to understand the solution, but the easiest way for me to think about it is this:  You should switch because you were more likely to have picked a goat (2/3) in your initial guess.

So, let's play this game n times in python and see if this conclusion holds.

1
2
3
4
5
6
7
8
9
10
11
12
13
14
15
16
17
18
19
20
21
22
23
24
25
26
27
28
29
30
import random
 
#number of games to play
n = 100000
#number of correct guesses on first guess
correct = 0
 
# run simulations
for i in range(n):
    # place car behind random door
    doors = ['car','goat','goat']
    random.shuffle(doors)
 
    # contestant guesses
    guess_door = random.randint(0,2)
    guess = doors.pop(guess_door)
 
    # Monty Hall reveals one of the doors that he knows contains a goat.
    doors.remove('goat')
 
    # last unopened door
    remaining_door = doors[0]
 
    # check if you are correct on your first guess
    if guess == 'car':
        correct += 1
 
# correct percentage from staying on original door
per = str(100.0*correct/n)
print 'You are correct %s%% of the time when sticking with your first guess\n' % per

After 100,000 games:

You are correct 33.309% of the time when sticking with your first guess

A 33.33..% chance is 1/3, and so that means you have 1-1/3 = 2/3 odds of getting the car when switching.

A sprinkle of print statements in the code (here) can help convince you that it's actually doing what the problem describes.  Here's a run of 5 games, printing out things at each step:

cycle 0
doors: ['car', 'goat', 'goat']
first guess: 2 (goat)
remaining doors after guess: ['car', 'goat']
remaining door after revealing goat: ['car']
Wrong!

cycle 1
doors: ['goat', 'car', 'goat']
first guess: 2 (goat)
remaining doors after guess: ['goat', 'car']
remaining door after revealing goat: ['car']
Wrong!

cycle 2
doors: ['car', 'goat', 'goat']
first guess: 0 (car)
remaining doors after guess: ['goat', 'goat']
remaining door after revealing goat: ['goat']
Correct!

cycle 3
doors: ['car', 'goat', 'goat']
first guess: 1 (goat)
remaining doors after guess: ['car', 'goat']
remaining door after revealing goat: ['car']
Wrong!

cycle 4
doors: ['goat', 'goat', 'car']
first guess: 2 (car)
remaining doors after guess: ['goat', 'goat']
remaining door after revealing goat: ['goat']
Correct!

You are correct 40% of the time when sticking with your first guess

Aside:  40% isn't very close to 1/3, but that's because I only ran the simulation for 5 cycles in this case.  When the code is run with a larger n (like above with 100,000), the result is much closer 1/3.

Now on to the good stuff - with the problem explicitly laid out via python code, it's now very easy to see that lines 18-22 are completely irrelevant to the final calculation. This is surprising, but true: Given the problem details, the fact that Monty Hall eliminates a goat door does nothing to change the fact that you had only a 33.33...% chance of getting the car on your first guess. Since you were more likely to have guessed a goat on your first guess, the other remaing door more likely contains the car, and so you should switch.

U.S. Skatepark Density

Number of Skateparks


Number of Skateparks Per Million People

It's no surprise that California has the largest number of skateparks in the country.  But when you adjust for population size - dang Wyoming!  I want what you're having.

Data sources:

New project: wools++

I've taken on another minecraft related project in an attempt to learn some more python as well as some basic web development.


Introducing wools++

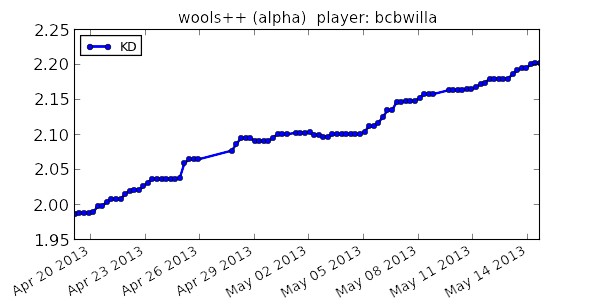
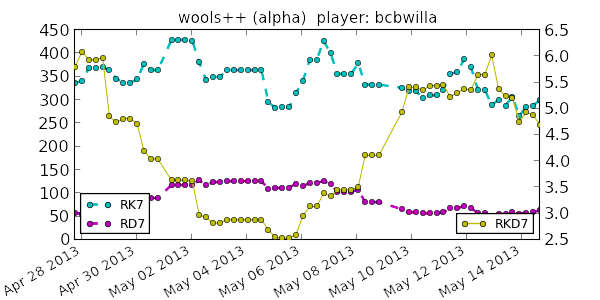
Centered on the Overcast Network (formerly Project Ares) collection of minecraft servers, wools++ collects data from a user's profile a few times per day and produces more sophisticated statistics (such as rolling values) and even some time series plots.  Here's a couple from my profile:

kd
rkd


With:

  • KD = kills/deaths
  • RK7 = rolling kills (kills over the last 7 days)
  • RD7 = rolling deaths
  • RKD7 = rolling KD

The name itself comes from a capture-the-flag type game often played on the servers, where the flag is replaced by a minecraft wool block.  If you successfully capture a wool block, your "wools" count is incremented.

The project is hosted on Google's app engine for a couple reasons.

  • It can be free (if your app is small enough)
  • Built in datastore (no need to worry about setting up my own SQL database or anything)
  • Python support.  This is great because python is generally a super useful language to know, particularly in the computational sciences.

In the future I'll definitely spend some time discussing the process I went through building this app, because in some cases Google's documentation was a little bit light on the details.  For now, check out the about page if you'd like to read about more details, and you can find the source here.