Simple LaTeX Table Generator

Anyone who's ever had to type up a large table in LaTeX knows that it can be a bit of work. When faced with a particulalry large table myself, I of course thought "why not python?".

It turns out there are already a few ways to generate latex tables, but here's my take:

1
2
3
4
5
6
7
8
9
10
11
12
13
14
15
16
17
18
19
20
21
22
23
24
25
26
27
28
29
30
31
32
33
34
35
36
37
38
39
40
41
42
43
44
45
46
47
48
49
50
51
52
53
54
55
56
57
58
59
""" This short script converts a CSV table into latex table.
 
Command Line Arguments:
 
required positional arguments:
infile input file name
 
optional arguments:
-h, --help show this help message and exit
-ncols N, --numbercolumns N
number of columns in file
-vd, --verticaldivider
adds vertical dividers to table
-hd, --horizontaldivider
adds horizontal dividers to table
"""
 
import csv
import sys
import argparse
 
# define and parse input arguments
parser = argparse.ArgumentParser()
parser.add_argument("infile", help="input file name")
parser.add_argument("-ncols", "--numbercolumns", type=int, help="number of columns in file", default=2)
parser.add_argument("-vd", "--verticaldivider", action="store_true", help="adds vertical dividers to table")
parser.add_argument("-hd", "--horizontaldivider", action="store_true", help="adds horizontal dividers to table")
args = parser.parse_args()
 
# csv input and latex table output files
infile = args.infile
outfile = infile +".table"
 
with open(infile, 'r') as inf:
    with open(outfile, 'w') as out:
        reader = csv.reader(inf)
 
        # build the table beginning code based on number of columns and args
        # columns all left justified
        code_header = "\\begin{tabular}{"
        for i in range(args.numbercolumns):
            code_header += " l "
            if i < args.numbercolumns - 1 and args.verticaldivider:
                code_header += "|"
        code_header += "}\n\\hline\n"
        out.write(code_header)
 
        # begin writing data
        for row in reader:
            # replace "," with "&"
            if args.horizontaldivider:
                out.write(" & ".join(row) + " \\\\ \\hline\n")
            else:
                out.write(" & ".join(row) + " \\\\ \n")
 
        if not args.horizontaldivider:
            out.write("\\hline\n")
 
        out.write("\\end{tabular}")

Example input file:

1,2,3
4,5,6

Running with the -vd and -hd flags to specify vertical and horizontal dividers produces:

\begin{tabular}{ l | l | l }
\hline
1 & 2 & 3 \\ \hline
4 & 5 & 6 \\ \hline
\end{tabular}

It's very minimal, and the main idea is that it does 95% of the work for you, leaving only very minor cosmetic tweaks.

Minecraft Minigame Match Dynamics

As a physics student, it can be difficult to not think of things as point particles - even players engaging in minecraft minigame matches on the Overcast Network.

So as a Saturday afternoon project, I made a simple client mod that allows you to write all of the player positions on the current world to a CSV file. Then, using  Mathematica, I processed the data and made some simple visualizations:

This shows the player positions, colored by team.  This match takes place on a map called Warlock (one of my favorites), and the goal is to be the first team to break the other team's monument (which is made out of two pieces of obsidian).  Red team won this match, and you can see a red guy sneaking near the blue's monument (probably underground) in the bottom left for a few minutes before finally breaking it.

See more visualizations here (I don't want to lag up the page with gifs), and view the source code here.

Custom PBS qstat output

I recently became slightly annoyed with the information being displayed by PBS's qstat command.  My main issue was that a simple qstat tends to cut off job names, which are very important if you're running multiple jobs with long, similar names that can't be distinguished when trimmed.  The other extreme, qstat -f, prints way too much information that's difficult to efficiently navigate through.

There's probably an option flag that's midway between the two, but it seemed like a fun idea to write a simple intercepting script that only printed a couple things I found useful.

First, here's the first few lines of one job from the output of qstat -f to give you an idea of what the script is working with:

Job Id: 54314.master.localdomain
    Job_Name = df-AC6hex-N2-h2-HSE1PBE-opt-gdv
    Job_Owner = bw@master.localdomain
    resources_used.cput = 113:03:48
    resources_used.mem = 3177372kb
    resources_used.vmem = 4856612kb
    resources_used.walltime = 118:20:42
    job_state = R
    queue = verylong
    ...

In the output, each job is separated by a blank line.  So, here's a python script that strips away some of the unneeded info, while printing the full job name:

1
2
3
4
5
6
7
8
9
10
11
12
13
14
15
16
17
18
19
20
21
22
23
24
25
26
27
28
29
30
31
32
33
#! /usr/bin/python
 
import subprocess
 
# get user name
user = subprocess.check_output(['whoami']).strip()
# get all jobs data
out = subprocess.check_output(['qstat','-f'])
lines = out.split('\n')
 
# build list of jobs, each job is a dictionary
jobs = []
for line in lines:
    if "Job Id:" in line:  # new job
        job = {}
        s = line.split(":")
        job_id = s[1].split('.')[0].strip()
        job[s[0].strip()] = job_id
    if '=' in line:
        s = line.split("=")
        job[s[0].strip()] = s[1].strip()
    elif line == '':
        jobs.append(job)
 
# print out useful information about user's jobs
print "\n   " + user + "'s jobs:\n"
for job in jobs:
    if job['Job_Owner'].split('@')[0] == user:        
        print "   " +  job['Job_Name']
        print "   Id: " + job['Job Id']
        print "   Wall time: " + job['resources_used.walltime']
        print "   State: " + job['job_state']
        print

Snippet of example output:

   bw's jobs:

   df-AC6hex-N2-h2-HSE1PBE-opt-gdv
   Id: 54314
   Wall time: 118:20:42
   State: R

   df-AC6hex-N2-h1b-HSE1PBE-opt-gdv
   Id: 54317
   Wall time: 118:13:38
   State: R

   df-AC6hex-N2-h2b-HSE1PBE-opt-gdv
   Id: 54321
   Wall time: 118:13:39
   State: R

   ...

The output of the command qstat -f is captured by python via the subprocess.check_output() function and organized into a dictionary, which allows for easy customization of what's printed out.  After that, it's just some basic string processing and printing.  Note also that it only prints information about the jobs of the user who is running the script.

Lennard R. Jones

I started learning a bit of R recently at a data processing workshop. I'm enjoying it so far. Sometimes it's nice to see what else is "out there" (as in, not python).

One interesting thing is the fact that many arithmetic operations on vectors are treated element-wise. So for example, adding two vectors with "+" just adds the corresponding elements. This can be useful for generating some quick function plots in very few lines and with no need for explicit loops or anything like that.

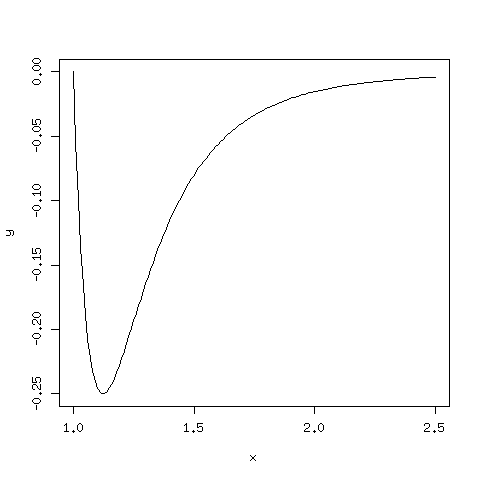
Here's a simple plot of the Lennard-Jones potential as you would create it in an interactive R session:

1
2
3
x <- seq(0,2.5,0.01)    # generate grid from 0 to 2.5 in steps of 0.01
y <- x^(-12) - x^(-6)   # evaluate Lennard-Jones potential on all grid points
plot(x,y,type="l")      # plot with a line

lrj

Of course, you can get fancier and create beautiful plots with R, but it's also nice for quick-and-dirty visualizations.

Monty Python: Kids in the Hall

Sorry, this is not a post about British or Canadian sketch comedy shows.  It's about a brute force simulation of the classic Monty Hall problem using python.  There are already a bunch of these online, but I was so disappointed in the lack of title puns that I decided to make my own.  Many of the existing simulations are quite good and fancy, so I like to classify mine as being more "back of the envelope" python.

Of all the problems that demonstrate the breakdown of statistical intution, the Monty Hall problem is certainly one of the most famous examples. There is already tons of information about it available online, so I won't go into much detail here.  For completeness, I'll shamelessly copy a simple variation of the problem statement from the wikipedia page (which I recommend you take a look at):

Suppose you're on a game show, and you're given the choice of three doors: Behind one door is a car; behind the others, goats. You pick a door, say No. 1, and the host (Monty Hall), who knows what's behind the doors, opens another door, say No. 3, which has a goat. He then says to you, "Do you want to pick door No. 2?" Is it to your advantage to switch your choice?

If this is your first time hearing the problem, think about it before you move on to the solution!  The answer follows this large picture of a goat which serves as a spoiler blocker:


Solution:

You should switch!  Switching gives you a 2/3 chance of getting the car.  This may (i.e. was most definitely probably) not your first intuitive conclusion, but it's the correct one.  Again, the wikipedia page provides many different ways to understand the solution, but the easiest way for me to think about it is this:  You should switch because you were more likely to have picked a goat (2/3) in your initial guess.

So, let's play this game n times in python and see if this conclusion holds.

1
2
3
4
5
6
7
8
9
10
11
12
13
14
15
16
17
18
19
20
21
22
23
24
25
26
27
28
29
30
import random
 
#number of games to play
n = 100000
#number of correct guesses on first guess
correct = 0
 
# run simulations
for i in range(n):
    # place car behind random door
    doors = ['car','goat','goat']
    random.shuffle(doors)
 
    # contestant guesses
    guess_door = random.randint(0,2)
    guess = doors.pop(guess_door)
 
    # Monty Hall reveals one of the doors that he knows contains a goat.
    doors.remove('goat')
 
    # last unopened door
    remaining_door = doors[0]
 
    # check if you are correct on your first guess
    if guess == 'car':
        correct += 1
 
# correct percentage from staying on original door
per = str(100.0*correct/n)
print 'You are correct %s%% of the time when sticking with your first guess\n' % per

After 100,000 games:

You are correct 33.309% of the time when sticking with your first guess

A 33.33..% chance is 1/3, and so that means you have 1-1/3 = 2/3 odds of getting the car when switching.

A sprinkle of print statements in the code (here) can help convince you that it's actually doing what the problem describes.  Here's a run of 5 games, printing out things at each step:

cycle 0
doors: ['car', 'goat', 'goat']
first guess: 2 (goat)
remaining doors after guess: ['car', 'goat']
remaining door after revealing goat: ['car']
Wrong!

cycle 1
doors: ['goat', 'car', 'goat']
first guess: 2 (goat)
remaining doors after guess: ['goat', 'car']
remaining door after revealing goat: ['car']
Wrong!

cycle 2
doors: ['car', 'goat', 'goat']
first guess: 0 (car)
remaining doors after guess: ['goat', 'goat']
remaining door after revealing goat: ['goat']
Correct!

cycle 3
doors: ['car', 'goat', 'goat']
first guess: 1 (goat)
remaining doors after guess: ['car', 'goat']
remaining door after revealing goat: ['car']
Wrong!

cycle 4
doors: ['goat', 'goat', 'car']
first guess: 2 (car)
remaining doors after guess: ['goat', 'goat']
remaining door after revealing goat: ['goat']
Correct!

You are correct 40% of the time when sticking with your first guess

Aside:  40% isn't very close to 1/3, but that's because I only ran the simulation for 5 cycles in this case.  When the code is run with a larger n (like above with 100,000), the result is much closer 1/3.

Now on to the good stuff - with the problem explicitly laid out via python code, it's now very easy to see that lines 18-22 are completely irrelevant to the final calculation. This is surprising, but true: Given the problem details, the fact that Monty Hall eliminates a goat door does nothing to change the fact that you had only a 33.33...% chance of getting the car on your first guess. Since you were more likely to have guessed a goat on your first guess, the other remaing door more likely contains the car, and so you should switch.

wools++: Major update!

I've totally revamped wools++.  Major changes include:

I have ideas for plenty of other features as well, and I'd be happy to take further suggestions.

Related, Overcast Network recently updated their stats system as well, providing statistics breakdowns based on game mode and playing time which is really cool (except, oh god, now I can easily see how much I play each day).  I plan on incorporating some of this new information into wools++ in the future.

New project: wools++

I've taken on another minecraft related project in an attempt to learn some more python as well as some basic web development.


Introducing wools++

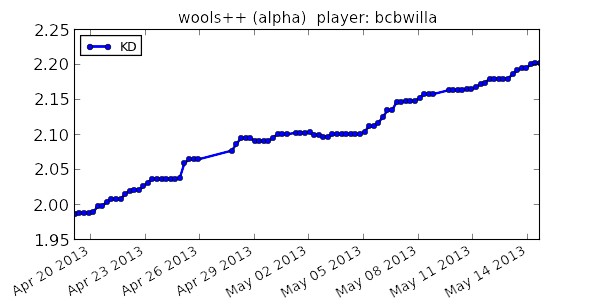
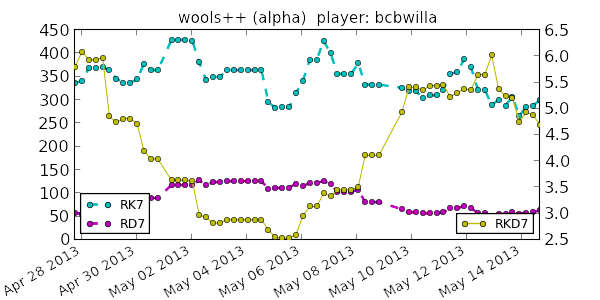
Centered on the Overcast Network (formerly Project Ares) collection of minecraft servers, wools++ collects data from a user's profile a few times per day and produces more sophisticated statistics (such as rolling values) and even some time series plots.  Here's a couple from my profile:

kd
rkd


With:

  • KD = kills/deaths
  • RK7 = rolling kills (kills over the last 7 days)
  • RD7 = rolling deaths
  • RKD7 = rolling KD

The name itself comes from a capture-the-flag type game often played on the servers, where the flag is replaced by a minecraft wool block.  If you successfully capture a wool block, your "wools" count is incremented.

The project is hosted on Google's app engine for a couple reasons.

  • It can be free (if your app is small enough)
  • Built in datastore (no need to worry about setting up my own SQL database or anything)
  • Python support.  This is great because python is generally a super useful language to know, particularly in the computational sciences.

In the future I'll definitely spend some time discussing the process I went through building this app, because in some cases Google's documentation was a little bit light on the details.  For now, check out the about page if you'd like to read about more details, and you can find the source here.