Using Chorus Fruit to Approximate Pi in Minecraft

Minecraft 1.9 introduces a new fruit which teleports a player randomly within a 64x64x64 cube. The obvious intended use of this new feature is Monte Carlo simulations.

One example of the Monte Carlo method is approximating the value of pi. You can do this by randomly picking points within a square, and then counting the number of points which fall within a circular arc.

To do this in Minecraft I (with some help), built a 64x64 square around a circular arc, stood in the center and ate a chorus fruit to randomly teleport within the square, marked the position, and then repeated.

The approximation gets better as you sample more points. In our case, we got to about 2.99 - not great, but still a demonstration of a powerful technique. The limiting factor here is the 64x64 square, where the best you can do is 3.10 if you actually count all of the squares.

Update: After posting on reddit, user yut951121 asked a good question:

More Fun with OCN Server Data

This is a follow up to the previous post about tracking Overcast Network's (OCN) server activity.

A couple things:

  1. At the time of that posting, there were only a few days of data in the database.  Since then, the script has been churning away for the past few weeks, giving us a much larger sample.
  2. The original scripts spend most of the time juggling dictionaries and reshaping the data to plot.  This isn't particularly elegant.  This time around I'm using Pandas for the data preprocessing after restructuring the database.

In retrospect, it would have probably made more sense to store the information in an SQL database. I used MongoDB only because I had never used it before (my favorite reason), and the prospect of being able to dump python dictionaries right in seemed fun.  And I pretty much did just that - dumping dictionaries of data - which seemed simple enough at the time but ultimately led to processing complications later (see above).

eu-counts

With all of this in mind, I played with the data a bit in an ipython notebook, and so it only makes sense to display the code and results using the very cool browser notebook viewer.  Check them out here!  (If you aren't using the ipython notebook daily, you're blowing it. It's a lot of fun.)

As you can see from the plots, the player count varies quite a bit throughout the day, even with a very large spread of players across the globe.  This can cause some issues since many of the servers are designed with a certain number of players in mind.  OCN recently implemented dynamic servers, which turn on and off depending on the number and distribution of players online and will hopefully solve this issue.

Code and more graphs

Tracking Overcast Network's Player Count with Python

eu_main


Python quickie!  Overcast Network is a large minecraft network and they have a lot of servers.  They don’t keep track of the player count on all of these servers over time, so to assess the popularity of the different servers I wrote some scripts to collect server data and plot the results.

The collection script runs every 15 minutes via cron, grabs data from the play page and dumps it in a mongoDB database.  The plotting class gets the data from the database and does a bunch of data maneuvering so it’s easy to work with (I should probably learn how to use data frames at some point) and then plots it with matplotlib:


eu_main

eu_main

These plots show the average player activity per day (in one hour bins).  There are only a few days worth of data shown here, which explains why the points tend to jump around a lot.  As more data is collected, things should smooth out a bit.  You can see more plots here.

Source

Related server tracking:

http://mc.ttaylorr.com/

Minecraft Physics: Steve in Drag

An object falling under constant acceleration travels a distance in an amount of time given by

where is the object's starting velocity.  For an object dropped from rest, .  Plugging that in and solving for , we find

   (1)

Using this equation, we can approximate the acceleration due to gravity in Minecraft by timing how long it takes something to fall some distance.  This model assumes constant acceleration, which means it ignores things like drag forces from air resistance.  It turns out, Minecraft actually does have air resistance, but we will get there a bit later.

Youtuber nopefully used the above approximation to determine the gravitational acceleration of sand blocks (further analyzed here).  Since then, though, the addition of command blocks and scoreboards provide a simple way to time things in game, so that's the approach I'll take.

Experiment

The dropper platform

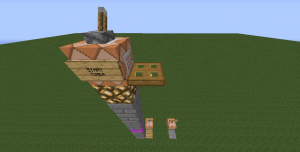
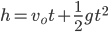
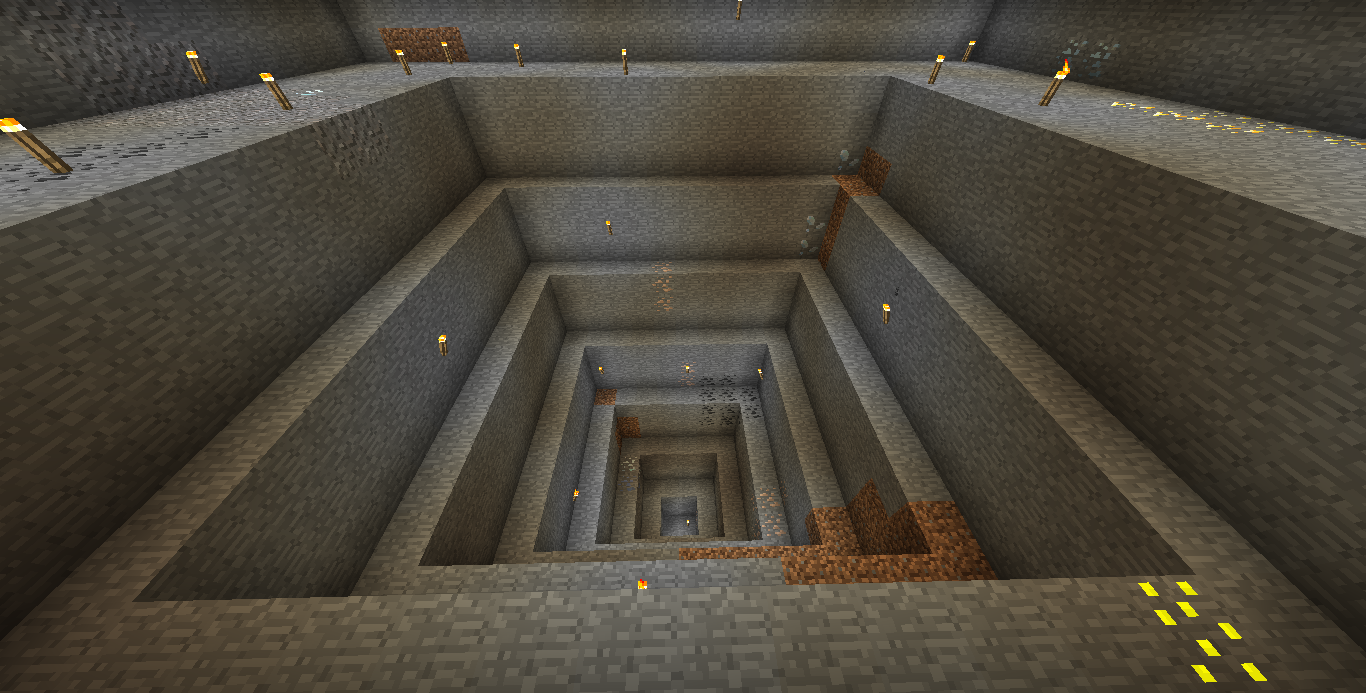
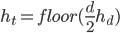
Figure 1: The dropper platform.

Timer stop and reset

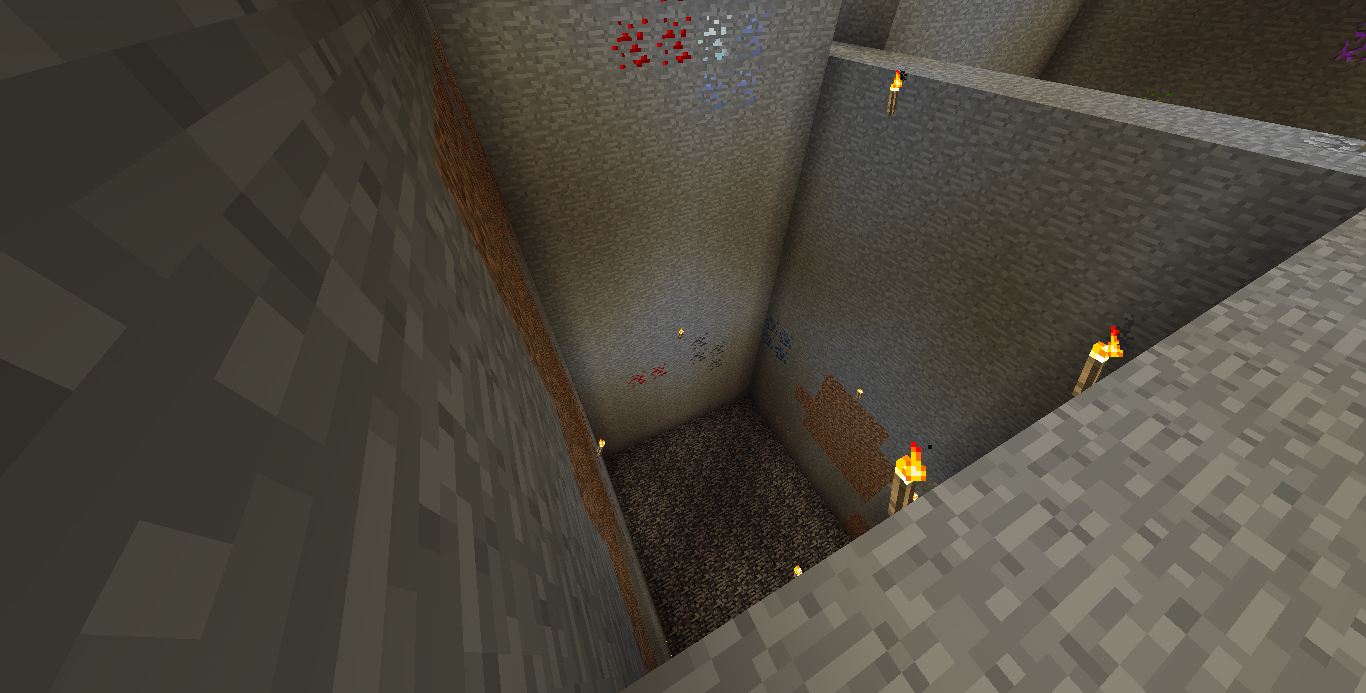
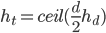
Figure 2: Timer stop and reset. The clock circuit is in the background.

The experiment is simple: jump off of stuff, time it with command blocks, and plug the result in the above equation (1) to figure out the gravitational acceleration of a player.  For timing, I used Sethbling's stopwatch design.  The timer-starting command block (figure 1) is activated by a lever which also triggers a trapdoor, causing you to fall onto a pressure plate below, stopping the timer (figure 2).

I repeated this experiment five times at three different heights.  The data is in the table below (remember, a Minecraft block is 1 meter on each side):

Table 1: Results
Height (m) Average Fall Time (s) Acceleration (m/s2)
10 0.94 22.63
20 1.34 22.28
40 1.88 22.63

So using model (1), Minecraft's gravitational acceleration is around 23 m/s2.  But as I mentioned above, we're neglecting air resistance.  There isn't an easy way to experimentally measure the air resistance, but luckily a video game provides us with something that nature does not: the source code.  So let's cheat a little bit and take a look under the hood.

Cheating

In the EntityLivingBase class, there's a method named moveEntityWithHeading that is called 20 times per second (each "tick"), updating the entity's velocity.  If there isn't a block under the living entity (in other words, it's falling), the downward velocity is increased by 0.08 and decreased by 2% each tick.  This means there's a constant acceleration component that is 0.08 blocks/tick2 = 32 m/s2 and a drag force that is directly proportional to the velocity.  32 m/s2 is a lot different than our measured 23 m/s2, so clearly the drag force is not something that can be ignored.  Also, 32m/s2 is over 3 times greater than the gravity on Earth!  (An inventory of cobble is seriously heavy.)

On Earth, the gravitational acceleration is about 9.8m/s2 near the surface, and is the same for all objects regardless of how much they weigh.  This isn't the case in Minecraft, as you can see in the more detailed table on Minecraft wiki.  The "drag" contribution is also different for different entities (which is slightly more realistic since air resistance depends on the size and shape of the object).


Fluid Dynamics

The existence of a non-negligible drag force complicates the task of experimentally determining Minecraft's gravitational acceleration.  But it also means that we have a more fun differential equation to play with!  We can start out by writing down the equations of motion for the object falling.  From the source code, we know that the drag force is proportional to the velocity, so we can use a linear drag model for the forces:

where is the object's mass, is the total acceleration, is the acceleration due to gravity, is some sort of drag coefficient and is the object's velocity.  Remembering from physics class that acceleration is the first derivative of velocity with respect to time (denoted ), we can substitute .  Doing that and diving both sides by gives us an equation for the total acceleration:

The value of is what's in the "Drag" column in the Minecraft wiki tableSolving for the velocity as a function of time, we find

   (2)

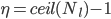
We can take some values of and from the table and graph the velocity (equation 2) of each of the different entities as they fall:

The velocity increases for a bit, but the rate at which it increases (the acceleration) slows with time until the entity travels at a constant velocity.  This is called terminal velocity, and it's reached when the gravitational force and the force due to air resistance balance out.  You can see that a falling player can catch up to most other entities, except for fired arrows.*

You can see the raw data in a Google spreadsheet here.  I encourage you to try out this set up and Minecraft physics experiments.  Please share your findings!


*So if, for example, you're engaging in a PvP fight on Overcast Network and someone tries to jump out of the world to deny you a kill, look over the edge and shoot!  Your arrow has a chance of catching up to them.

Overcast Network and the Blue Team Advantage

Overcast Network (OCN) is a minecraft server network that features player vs. player (PvP) minigames.  There are a variety of gamemodes that take place on over 100 maps, where matches can last anywhere from a few seconds to a few hours.

The matches typically involve two teams of various colors, but the most common match up is red vs. blue.  This is signified through things like dyed armor and colored name tags.  Some people have speculated that, in certain situations, one team may have an advantage over the other.  Blue, for example, blends in better with water.  Red blends in better with things like lava and other reddish blocks, but seems to be, overall, an easier color to spot.  Some players even go out of their way to join one team color over the other, perhaps trying to take advantage of this.

Viridun

Viridun

Another potential advantage-yielding asymmetry is literal asymmetry in map design.  Most of the maps being played are symmetric for all teams - one team's side is either a mirror image or a 180 degree rotation of the other.  The map Viridun is the best example of an exception to this.  On Viridun, both teams have the same starting gear, but the map is asymmetric both spatially and in the distribution of potions hidden in various places.

The effect of these asymmetries can be tested by looking at a large number of matches and seeing who wins more often.  Perfect symmetry would be when each team wins a match 50% of the time (I'm only looking at maps with two teams here).  Of course, we can only look at a finite number of matches and so we'd expect some variation from 50%, but we can determine if this variation is within the expected range by using some basic statistics.

Results

Overall, blue won 49.685% of the matches (that sort of graph looks kind of familiar!).  This is consistent with no systematic advantage (or at least, no systematic advantage that is being exploited by players).  Breaking it down by gamemode, there is some variation, but none of the differences are statistically significant.

Looking at Viridun, however, we find that blue wins 66% of matches, which is statistically significant.  This is probably due to some combination of actual imbalances in the map and the fact that players who are very familiar with the map are aware of these imbalances and so are more likely to join the blue team, resulting in a better team.

Supporting Materials

 Data

Game Matches Blue Wins Χ2 V p
Overall 1270 49.6% 0.0504 0.0014 0.8224
Mini 450 48.4% 0.4356 0.0205 0.5093
CTW 107 57.9% 2.7009 0.2611 0.1003
DTC / DTM 85 49.4% 0.0118 0.0013 0.9136
TDM 38 55.3% 0.4211 0.0683 0.5164
Blitz 384 47.4% 1.0417 0.0532 0.3074
Viridun 142 66.2% 14.9015 1.2500 0.0001

Gamemode Glossary

  • CTW (Capture the Wool) - One team tries to capture wool blocks from the other team's side (capture the flag, basically).
  • DTC (Destroy the Core) - One team tries to leak lava from a team's core by breaking it.  A variation of this is DTM (destroy the monument), which involves breaking the blocks of another team's monument with no lava involved.
  • TDM (Team Death Match) - Teams try to accumulate the most kills and least deaths.
  • Blitz - Usually TDM, and you have limited lives.  A variation of this, Rage, includes weapons that kill in only one hit.
  • Mini - "Mini" versions of DTM, DTC, and CTW that have smaller team sizes and maps.

Quarrying with ComputerCraft Turtles

I just recently began playing with ComputerCraft, which is a very cool Minecraft mod that adds programmable computers.   There are also turtles, which are basically computers that can carry out tasks like mining, digging, attacking, etc.  Turtles are fully programmable using Lua and various APIs.  You can do lots of amazing things with turtles.

This is not something amazing, but just a simple modification I made to the turtle's excavate program that allows you to dig stepped quarries giving easier retrieval of the ores around the edges:

9x9 excavate:

excavate14x14x3 quarry:quarry

 Source. You can copy this script directly to your turtle using the turtle's pastebin program.

To dig a quarry, you specify the diameter and the number of blocks to dig down at each diameter, .

It's a fun exercise to work out some of the properties of the resulting quarries.  Given a and , you can dig a quarry that is blocks deep, where if is even and if is odd.  The total height of the quarry is related to the number of constant-diameter levels, by .

Given a and , the total number of blocks you mine in a quarry, , is found by simply adding up all the blocks at a given level and then adding all the levels.  Noting that decreases by two blocks each time you make the quarry square smaller,

where is related to .   Writing this in summation form,

where .  Now, the summation bit is straightforward to see, but the upper limit took some playing around in Mathematica for me to work it out.  This seems to work pretty well, but if anyone can derive this limit (or a better one) more "rigorously", please let me know!