This is a follow up to the previous post about tracking Overcast Network's (OCN) server activity.
A couple things:
- At the time of that posting, there were only a few days of data in the database. Since then, the script has been churning away for the past few weeks, giving us a much larger sample.
- The original scripts spend most of the time juggling dictionaries and reshaping the data to plot. This isn't particularly elegant. This time around I'm using Pandas for the data preprocessing after restructuring the database.
In retrospect, it would have probably made more sense to store the information in an SQL database. I used MongoDB only because I had never used it before (my favorite reason), and the prospect of being able to dump python dictionaries right in seemed fun. And I pretty much did just that - dumping dictionaries of data - which seemed simple enough at the time but ultimately led to processing complications later (see above).
With all of this in mind, I played with the data a bit in an ipython notebook, and so it only makes sense to display the code and results using the very cool browser notebook viewer. Check them out here! (If you aren't using the ipython notebook daily, you're blowing it. It's a lot of fun.)
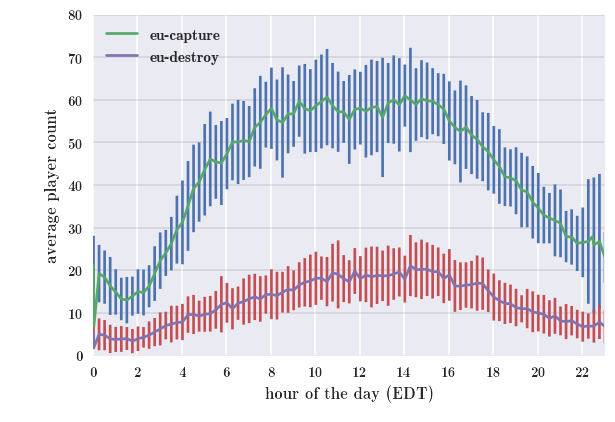
As you can see from the plots, the player count varies quite a bit throughout the day, even with a very large spread of players across the globe. This can cause some issues since many of the servers are designed with a certain number of players in mind. OCN recently implemented dynamic servers, which turn on and off depending on the number and distribution of players online and will hopefully solve this issue.